Linux - Member Desktop ScreenshotsThis forum is for the discussion and display of Linux Desktop screenshots. Please remember that many members browse LQ from work, so NSFW screenshots are not appropriate.
Notices
Welcome to LinuxQuestions.org, a friendly and active Linux Community.
You are currently viewing LQ as a guest. By joining our community you will have the ability to post topics, receive our newsletter, use the advanced search, subscribe to threads and access many other special features. Registration is quick, simple and absolutely free. Join our community today!
Note that registered members see fewer ads, and ContentLink is completely disabled once you log in.
If you have any problems with the registration process or your account login, please contact us. If you need to reset your password, click here.
Having a problem logging in? Please visit this page to clear all LQ-related cookies.
Get a virtual cloud desktop with the Linux distro that you want in less than five minutes with Shells! With over 10 pre-installed distros to choose from, the worry-free installation life is here! Whether you are a digital nomad or just looking for flexibility, Shells can put your Linux machine on the device that you want to use.
Exclusive for LQ members, get up to 45% off per month. Click here for more info.
You can even combine them with other things . A Chronograph with weather.
Debian SID / OpenBox / tint2 / Compton
or 4 clocks by mrpeachy:
You can use just one one, or two or three or five or .... and build a full conky under them or put them in the middle of a conky.
The numbers are hours in 24 hour time, suppose I could put the date under GMT (UTC) as well
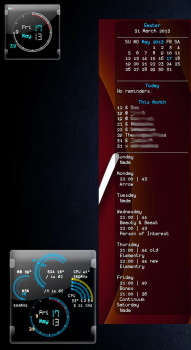
More clocks and my calendar conky:
If I have misunderstood that it just a work in progress ... I apologize
I have two Conkies, because I want the calendar centred. Including it in the main Conky aligns it to the left, and the calendar is too large for my taste if big enough to match the width of the other Conky.
As for the clock. I have tried a couple analogue clocks, but have not been able to get them to display properly. I get text instead of a clock. So it could be considered a work in progress, until I figure it out. Two of your links have given me an idea. Thanks for them. Perhaps the problem is related to lua. I saw a couple things that might solve the problem.
Simple Netbook conkyrc. Small screen real estate here (9" screen). acpi has a issue with the Battery and I spent a day investigating trying to get more info but hwmon and /sys were dead ends. This is a one of a kind netbook when it comes to hard ware any ways so I can't expect everything from acpi to work (in other words, I am not sweating the small stuff). Just the nature of the beast on this one. Like I said, simple and to the point.
Code:
$ acpi
Battery 0: Discharging, 69%, rate information unavailable
.conkyrc file
Code:
# set to yes if you want Conky to be forked in the background
background yes

cpu_avg_samples 2
net_avg_samples 2

out_to_console no

# X font when Xft is disabled, you can pick one with program xfontsel
#font 7x12
#font 6x10
#font 7x13
font 8x12
#font 7x12
#font *mintsmild.se*
#font -*-*-*-*-*-*-34-*-*-*-*-*-*-*
#font -artwiz-snap-normal-r-normal-*-*-100-*-*-p-*-iso8859-1

# Use Xft?
use_xft yes

# Xft font when Xft is enabled
xftfont gentium:size=11

own_window_transparent yes
own_window_colour hotpink
own_window_type desktop

# Create own window instead of using desktop (required in nautilus, pcmanfm and rox desktops)
own_window no

# Text alpha when using Xft
xftalpha 0.8

#on_bottom no

# mail spool
mail_spool $MAIL

# Update interval in seconds
update_interval 15

# Use double buffering (reduces flicker, may not work for everyone)
double_buffer yes

# Minimum size of text area
minimum_size 5 5
maximum_width 200

# Draw shades?
draw_shades no

# Draw outlines?
draw_outline no

# Draw borders around text
draw_borders no

# Stippled borders?
stippled_borders 0

# border margins
border_margin 10

# border width
border_width 2

# Default colors and also border colors
#default_color 996600
#default_color cc00ff
#default_color 993300
#default_color cc6633
#default_color ff9900
#default_color grey
#default_color red
#default_color blue
#default_color green
default_color white
#default_color black
default_shade_color white
default_outline_color white

# Text alignment, other possible values are commented
#alignment top_left
alignment top_right
#alignment bottom_left
#alignment bottom_right

# Gap between borders of screen and text

gap_x 10
gap_y 10

# Add spaces to keep things from moving about?  This only affects certain objects.
use_spacer right

# Subtract file system buffers from used memory?
no_buffers yes

# set to yes if you want all text to be in uppercase
uppercase no

# boinc (seti) dir
# seti_dir /opt/seti

# Possible variables to be used:
#
#      Variable         Arguments                  Description
#  acpiacadapter                     ACPI ac adapter state.
#  acpifan                           ACPI fan state
#  acpitemp                          ACPI temperature.
#  adt746xcpu                        CPU temperature from therm_adt746x
#  adt746xfan                        Fan speed from therm_adt746x
#  battery           (num)           Remaining capasity in ACPI or APM
#                                    battery. ACPI battery number can be
#                                    given as argument (default is BAT0).
#  buffers                           Amount of memory buffered
#  cached                            Amount of memory cached
#  color             (color)         Change drawing color to color
#  cpu                               CPU usage in percents
#  cpubar            (height)        Bar that shows CPU usage, height is
#                                    bar's height in pixels
#  downspeed         net             Download speed in kilobytes
#  downspeedf        net             Download speed in kilobytes with one
#                                    decimal
#  exec              shell command   Executes a shell command and displays
#                                    the output in torsmo. warning: this
#                                    takes a lot more resources than other
#                                    variables. I'd recommend coding wanted
#                                    behaviour in C and posting a patch :-).
#  execi             interval, shell Same as exec but with specific interval.
#                    command         Interval can't be less than
#                                    update_interval in configuration.
#  fs_bar            (height), (fs)  Bar that shows how much space is used on
#                                    a file system. height is the height in
#                                    pixels. fs is any file on that file
#                                    system.
#  fs_free           (fs)            Free space on a file system available
#                                    for users.
#  fs_free_perc      (fs)            Free percentage of space on a file
#                                    system available for users.
#  fs_size           (fs)            File system size
#  fs_used           (fs)            File system used space
#  hr                (height)        Horizontal line, height is the height in
#                                    pixels
#  i2c               (dev), type, n  I2C sensor from sysfs (Linux 2.6). dev
#                                    may be omitted if you have only one I2C
#                                    device. type is either in (or vol)
#                                    meaning voltage, fan meaning fan or temp
#                                    meaning temperature. n is number of the
#                                    sensor. See /sys/bus/i2c/devices/ on
#                                    your local computer.
#  kernel                            Kernel version
#  loadavg           (1), (2), (3)   System load average, 1 is for past 1
#                                    minute, 2 for past 5 minutes and 3 for
#                                    past 15 minutes.
#  machine                           Machine, i686 for example
#  mails                             Mail count in mail spool. You can use
#                                    program like fetchmail to get mails from
#                                    some server using your favourite
#                                    protocol. See also new_mails.
#  mem                               Amount of memory in use
#  membar            (height)        Bar that shows amount of memory in use
#  memmax                            Total amount of memory
#  memperc                           Percentage of memory in use
#  new_mails                         Unread mail count in mail spool.
#  nodename                          Hostname
#  outlinecolor      (color)         Change outline color
#  pre_exec          shell command   Executes a shell command one time before
#                                    torsmo displays anything and puts output
#                                    as text.
#  processes                         Total processes (sleeping and running)
#  running_processes                 Running processes (not sleeping),
#                                    requires Linux 2.6
#  shadecolor        (color)         Change shading color
#  stippled_hr       (space),        Stippled (dashed) horizontal line
#                    (height)
#  swapbar           (height)        Bar that shows amount of swap in use
#  swap                              Amount of swap in use
#  swapmax                           Total amount of swap
#  swapperc                          Percentage of swap in use
#  sysname                           System name, Linux for example
#  time              (format)        Local time, see man strftime to get more
#                                    information about format
#  totaldown         net             Total download, overflows at 4 GB on
#                                    Linux with 32-bit arch and there doesn't
#                                    seem to be a way to know how many times
#                                    it has already done that before torsmo
#                                    has started.
#  totalup           net             Total upload, this one too, may overflow
#  updates                           Number of updates (for debugging)
#  upspeed           net             Upload speed in kilobytes
#  upspeedf          net             Upload speed in kilobytes with one
#                                    decimal
#  uptime                            Uptime
#  uptime_short                      Uptime in a shorter format
#
#  seti_prog                         Seti@home current progress
#  seti_progbar      (height)        Seti@home current progress bar
#  seti_credit                       Seti@hoome total user credit


## antiX additives examples. Add below Text##
##${color cccccc}battery: ${color cccccc}$acpiacadapter, ${battery_percent BAT1}%
##${color}battery:${color} ${battery}
##Witeless example##
#${color cccccc}Wireless:
#${color cccccc}essid: ${wireless_essid wlan0}
#${color cccccc}IP:${color cccccc} ${addr wlan0}
#${color cccccc}speed: ${color cccccc} ${wireless_bitrate wlan0}
#${color cccccc}link strength: ${color cccccc} ${wireless_link_bar 7,50 wlan0}

# stuff after 'TEXT' will be formatted on screen

TEXT
${color}Biker: AntiX 13
${color}$sysname $kernel
#Kernel:${exec /home/harry/Documents/kernelname}
${color}Uptime: $uptime
${color}${time %a %d %b %k:%M}
Weather:${execi 300 /home/harry/.weather.sh 79772}
${color}Monitors:
${color}Cpu: ${color}${cpu}%
${color}Cpu: ${color}${hwmon 0 temp 1}${color} C
${color}ram : ${color}$mem${color}/${color}$memmax ${color}- ${color}$memperc%
${color}processes: ${color}$processes  ${color}running: ${color}$running_processes
Received rate: ${downspeed wlan0} k/s ${alignr}Upload rate: ${upspeed wlan0} k/s
${color}${downspeedgraph wlan0 20,80 444444 eeeeee} ${alignr}${upspeedgraph wlan0 20,80 444444 eeeeee}$color
Download Total: ${totaldown wlan0} ${alignr}Sent Total: ${totalup wlan0}
${color}link strength: ${color} ${wireless_link_bar 7,50 wlan0}
${color}Bat:${battery BAT1}
#${battery_time BAT1}
${alignr}${battery_bar 6,200 BAT1}
${color}Root:${color} ${fs_free /} ${color}= ${fs_free_perc /}%
${color }${fs_free /}/ ${fs_size /} ${fs_bar /}
weather here in the desert hardly changes. 100+ F is the norm for summer so I just run a simple weather script I borrowed from Arch Linux' You will need curl and perl installed to run s this .sh file. Make sure in properties it is executable
.weather.sh file
Code:
#!/bin/sh
#AccuWeather (r) RSS weather tool for conky
#
#USAGE: weather.sh <locationcode>
#
#(c) Michael Seiler 2007

METRIC=0 #Should be 0 or 1; 0 for F, 1 for C

if [ -z $1 ]; then
    echo
    echo "USAGE: weather.sh <79772>"
    echo
    exit 0;
fi

curl -s http://rss.accuweather.com/rss/liveweather_rss.asp\?metric\=${METRIC}\&locCode\=$1 | perl -ne 'if (/Currently/) {chomp;/\<title\>Currently: (.*)?\<\/title\>/; print "$1"; }'
I have two Conkies, because I want the calendar centred. Including it in the main Conky aligns it to the left, and the calendar is too large for my taste if big enough to match the width of the other Conky.
As for the clock. I have tried a couple analogue clocks, but have not been able to get them to display properly. I get text instead of a clock. So it could be considered a work in progress, until I figure it out. Two of your links have given me an idea. Thanks for them. Perhaps the problem is related to lua. I saw a couple things that might solve the problem.
Try one of these for your calendar: font used is monofur
Code:
${goto 30}SU MO ${color6}${time %b %Y}${color} FR SA
${goto 30}${color}${execp LAR=`date +%-d`; ncal -bh | sed '2d' | sed -e '1d' -e 's/\<'$LAR'\>/${color6}&${color}/' | sed ':a;N;$!ba;s/\n/\n${goto 30}/g'}


${goto 30}${color}${execp LAR=`date +%-d`; ncal -bh | sed -e '1d' -e 's/\<'$LAR'\>/${color6}&${color}/' | sed ':a;N;$!ba;s/\n/\n${goto 30}/g'}
Top, with two lines, puts the month (short) and year between 'Mo' and 'Fr', using three ${goto xx} commands.
and the bottom one line uses the calendars names and two ${goto xx} commands.
For LUA clocks are you adjusting the rings with the x,y values?
Example:
Code:
-- HOURS
clock_h = {
    {
    name='time',                   arg='%H',                    max_value=12,
    x=110,                         y=80,      -- these set the top, left corner of the "square" the circle is in.
    graph_radius=53,
    graph_thickness=3,
    graph_unit_angle=30,           graph_unit_thickness=30,
    graph_bg_colour=0xffffff,      graph_bg_alpha=0.0,
    graph_fg_colour=0xFFFFFF,      graph_fg_alpha=0.3,
    txt_radius=34,
    txt_weight=1,                  txt_size=10.0,
    txt_fg_colour=0xFFFFFF,        txt_fg_alpha=0.6,
    graduation_radius=53,
    graduation_thickness=6,        graduation_mark_thickness=2,
    graduation_unit_angle=30,
    graduation_fg_colour=0xFFFFFF, graduation_fg_alpha=0.3,
    },
I finally got around to playing with it today. My theory of a lua relationship was completely wrong. It looks like my problems were syntax errors when adding them to the Openbox startup.sh, and in one or two instances, placing rc files in the wrong place. At least for a couple of the clocks. A couple others still want to display text, instead of a clock.
The good news:
I have managed to get one of the clocks to work.
The bad news:
It does not have transparent styles, which is what I want.
So half way there. It should not be much longer before I have the clock of my dreams.
Last edited by Randicus Draco Albus; 05-23-2013 at 03:39 AM.
I finally got around to playing with it today. My theory of a lua relationship was completely wrong. It looks like my problems were syntax errors when adding them to the Openbox startup.sh, and in one or two instances, placing rc files in the wrong place. At least for a couple of the clocks. A couple others still want to display text, instead of a clock.
The good news:
I have managed to get one of the clocks to work.
The bad news:
It does not have transparent styles, which is what I want.
So half way there. It should not be much longer before I have the clock of my dreams.
If you are running multiple conkys from he OpenBox startup script you can try what I do and as the very last command in that script run a Start/Stop Conky bash script:
Code:
## Start all Conkys after a slight delay
(sleep 2s && ~/bin/ssc.sh) &

exit
You can see a sample of the ssc.sh at Conky PitStop. I use the short version on the bottom of the page.
Transparency - what composite manager are you running? It's important.
For now I am running multiple Conkies, because it is easier for me to run a clock separately, until I can figure out how to integrate a clock into a single Conky. My first priority is getting a clock I like to display, instead of one or two large letters. It is a combination of what to add, what not to add, where to add it and probably a fount issue. Not being a computer competent, it takes me a while to figure things out. But eventually it will be done. At the moment, I am happy with my progress.
My compositor is Compiz. Has worked fine for everything so far, so unlikely (but not a certainty) a problem.
I've tried some lua scripting for nvidia graphics card monitoring, it did not work well graphically (maybe not the right fonts), so I feel I've regressed to bold statements.
I got some errors in the gui, like the Gpu speed and Gpu temp.
I'm still learning, and have to read the docs.
brb, Glenn
Quote:
I seem to have lost my sanity. Has anyone found it?
I'm sure it's backed up somewhere!
I expect to add system fans and a weather/surf section. got some good info, working on it... after some rest.
Last edited by GlennsPref; 07-09-2013 at 04:37 AM.
Reason: I expect to add system
For now I am running multiple Conkies, because it is easier for me to run a clock separately, until I can figure out how to integrate a clock into a single Conky. My first priority is getting a clock I like to display, instead of one or two large letters. It is a combination of what to add, what not to add, where to add it and probably a fount issue. Not being a computer competent, it takes me a while to figure things out. But eventually it will be done. At the moment, I am happy with my progress.
My compositor is Compiz. Has worked fine for everything so far, so unlikely (but not a certainty) a problem.
I'm sorry, I never got a notification of this post.
Clocks are not hard to integrate into conky. Are you looking for a LUA clock?
ie: Londonali1010's Air Clock has a semi transparent outer ring that bends nicely with the background.
I've tried some lua scripting for nvidia graphics card monitoring, it did not work well graphically (maybe not the right fonts), so I feel I've regressed to bold statements.
I got some errors in the gui, like the Gpu speed and Gpu temp.
I'm still learning, and have to read the docs.
brb, Glenn
I'm sure it's backed up somewhere!
I expect to add system fans and a weather/surf section. got some good info, working on it... after some rest.
Install: lm-sensors, hddtemp.
Do you have nvidia-settings installed?
Read this to get started with getting your temperatures and such working: Using Sensors
AMD 8 core - easy ... CPU % usage:
CPU usage for the 8 CPUs
${cpu cpu1}, ${cpu cpu2}, ${cpu cpu3}, ${cpu cpu4}
${cpu cpu5}, ${cpu cpu6}, ${cpu cpu7}, ${cpu cpu8}
and ${cpu cpu0}% to give you the average usage of the 8.
nvidia commands are available in conky:
${nvidia temp}° will give you the CPU temperature - I don't think separate CPU temps are available for Nvidia CPU's.
Quote:
nvidia threshold Nvidia graficcard support for the XNVCtrl library. Each option can be shortened to the least significant part. Temperatures are printed as float, all other values as integer.
threshold - The thresholdtemperature at which the gpu slows down
temp - Gives the gpu current temperature
ambient - Gives current air temperature near GPU case
gpufreq - Gives the current gpu frequency
memfreq - Gives the current mem frequency
imagequality - Which imagequality should be chosen by OpenGL applications
I now have most of the details and how to get them sorted.
Next is the Surf report, Brisbane area +-500Km, Australia, which I believe I can do standing on the shoulders of others. :-)
But the surf report will probably need to be in another conky, due to space requirements, atm.
/etc/conky/conky.conf
Code:
use_spacer right

# set to yes if you want tormo to be forked in the background
#background yes

use_xft yes

# Xft font when Xft is enabled
xftfont Bitstream Vera Sans Mono-9
#xftfont Andale Mono-9
#xftfont Clean-9
#xftfont cubicfive10:pixelsize=10
#xftfont squaredance10:pixelsize=14
#xftfont swf!t_v02:pixelsize=12

# Text alpha when using Xft
xftalpha 0.65

mail_spool $MAIL

# Update interval in seconds
update_interval 1.0

# Create own window instead of using desktop (required in nautilus)
own_window yes
#own_window_type override
#own_window_transparent yes
own_window_hints undecorated,below,sticky,skip_taskbar,skip_pager

# Use double buffering (reduces flicker, may not work for everyone)
double_buffer yes

# Minimum size of text area
minimum_size 230
maximum_width 320

# Draw shades?
draw_shades no

# Draw outlines?
draw_outline no # amplifies text

# Draw borders around text
draw_borders no

# Stippled borders?
stippled_borders 0

# border margins
#border_margin 0

# border width
border_width 2

# Default colors and also border colors, grey90 == #e5e5e5
default_color grey90
default_shade_color black
default_outline_color DarkGrey

# Text alignment, other possible values are commented
#alignment top_left
alignment top_right
#alignment bottom_left
#alignment bottom_right

# Gap between borders of screen and text
gap_x 10
gap_y 25

# Subtract file system buffers from used memory?
no_buffers yes

# set to yes if you want all text to be in uppercase
uppercase no

# pad the % outputs to two places, and use short units
short_units yes
pad_percents 2

# stuff after 'TEXT' will be formatted on screen
TEXT
${texeci 3600 feh --bg-scale "`grep 'wallpaper=' ~/.kde4/share/config/plasma-appletsrc | tail --bytes=+11`"}
$color
${color #dc0e0e}System ${hr 2}$color
${color white}$nodename $sysname $kernel on $machine
Uptime:$uptime
${color white}${time %A %B %e, %G} ${color #00ff00}${time %I:%M:%S}${time %p} ${time %Z}
${color white}Processes:${color green} $processes ${color white}Running:${color green} $running_processes ${color white}
${color #dc0e0e}Cpu ${hr 1}$color
${color white}CPU Temp:${exec sensors | grep -n 'temp1' | sed -n 1p | awk -F'+' '{print $2}' | awk -F' ' '{print $1}'}
${color white}CPU Usage:${color green}${cpu cpu0}% ${color #DFDFDF}${cpubar}
${color #DFDFDF}${cpugraph} ${color #DFDFDF}
${color #dc0e0e}Graphics ${hr 2}$color
${color white}GPU Freq:${execi 5 nvidia-settings -t -q GPUCurrentProcessorClockFreqs | sed -n 2p}MHz
${color white}GPU Mem Used:${execi 5 nvidia-settings -t -q UsedDedicatedGPUMemory}Mb
${color white}GPU Temp:${execi 5 nvidia-settings -t -q GPUCoreTemp | sed -n 2p}°C
${color #dc0e0e}Cooling ${hr 1}$color
${color cyan}Noctua NH-U12P-se2:${exec sensors | grep -n 'fan1' | awk -F'+' '{print $1}' | awk -F' ' '{print $2}'}rpm
${color cyan}Top Case Fan:${exec sensors | grep -n 'fan2' | awk -F'+' '{print $1}' | awk -F' ' '{print $2}'}rpm
${color cyan}Rear Case Fan:${exec sensors | grep -n 'fan3' | awk -F'+' '{print $1}' | awk -F' ' '{print $2}'}rpm
${color cyan}Front Case Fan:${exec sensors | grep -n 'fan4' | awk -F'+' '{print $1}' | awk -F' ' '{print $2}'}rpm
${color cyan}GPU Fan:${execi 5 nvidia-settings -t -q GPUCurrentFanSpeed}%
${color #dc0e0e}Hdd ${hr 2}$color
${color white}used:${color green} ${fs_used_perc /}% ($fs_used/$fs_size) $alignr ${color white}
${color #DFDFDF}${fs_bar 6 /}$color
${color white}disk IO:${color green} $diskio
${color #dc0e0e}Memory ${hr 2}$color
${color white}RAM used:${color green} $memperc% ($mem/$memmax)
${color #DFDFDF}${membar 6}$color
${color #DFDFDF}${memgraph 25,320}$color
${color white}swap used:${color green} $swapperc% ($swap/$swapmax)
${color #DFDFDF}${swapbar 6}$color
${color #dc0e0e}Networking ${hr 2}$color
${color #dc0e0e}Internet ${hr 2}$color
${color white}Down: ${color green}${downspeed eth0} k/s ${alignr}${color white}Up:${color green} ${upspeed eth0} k/s
${color #DFDFDF}${downspeedgraph eth0 25,140 FF8200 ff0000} ${alignr}${upspeedgraph eth0
25,140 FF0000 FF9900}$color
${color white}Total: ${color green}${totaldown eth0} ${alignr}${color white}Total:${color green} ${totalup eth0}
${color white}Inbound:${color green} ${tcp_portmon 1 32767 count}
${color white}Outbound:${color green} ${tcp_portmon 32768
61000 count}${alignr}${color white}Total:${color green} ${tcp_portmon 1 65535 count}
${color #dc0e0e}Squid ${hr 2}$colors
${color white}Down: ${color green}${downspeed eth1} k/s ${alignr}${color white}Up:${color green} ${upspeed eth1} k/s
${color #DFDFDF}${downspeedgraph eth1 25,140 FF8200 ff0000} ${alignr}${upspeedgraph eth1
25,140 FF0000 FF9900}$color
${color white}Total: ${color green}${totaldown eth1} ${alignr}${color white}Total:${color green} ${totalup eth1}
${color white}Inbound:${color green} ${tcp_portmon 1 32767 count}
${color white}Outbound:${color green} ${tcp_portmon 32768
61000 count}${alignr}${color white}Total:${color green} ${tcp_portmon 1 65535 count}
${color #dc0e0e}Internal lo ${hr 2}$colors
${color white}Down: ${color green}${downspeed lo} k/s ${alignr}${color white}Up:${color green} ${upspeed lo} k/s
${color #DFDFDF}${downspeedgraph lo 25,140 FF8200 ff0000} ${alignr}${upspeedgraph lo
25,140 FF0000 FF9900}$color
${color white}Total: ${color green}${totaldown lo} ${alignr}${color white}Total:${color green} ${totalup lo}
${color white}Inbound:${color green} ${tcp_portmon 1 32767 count}
${color white}Outbound:${color green} ${tcp_portmon 32768
61000 count}${alignr}${color white}Total:${color green} ${tcp_portmon 1 65535 count}
${color}Name              PID     CPU%   MEM%
${color #ddaa00} ${top name 1} ${top pid 1} ${top cpu 1} ${top mem 1}
${color lightgrey} ${top name 2} ${top pid 2} ${top cpu 2} ${top mem 2}
${color lightgrey} ${top name 3} ${top pid 3} ${top cpu 3} ${top mem 3}
${color lightgrey} ${top name 4} ${top pid 4} ${top cpu 4} ${top mem 4}
${color}Mem usage
${color #ddaa00} ${top_mem name 1} ${top_mem pid 1} ${top_mem cpu 1} ${top_mem mem 1}
${color lightgrey} ${top_mem name 2} ${top_mem pid 2} ${top_mem cpu 2} ${top_mem mem 2}
${color lightgrey} ${top_mem name 3} ${top_mem pid 3} ${top_mem cpu 3} ${top_mem mem 3}
Please see attached png file
Thanks heaps for your tips and other help, ie being on hand!. Thanks heaps!
LinuxQuestions.org is looking for people interested in writing
Editorials, Articles, Reviews, and more. If you'd like to contribute
content, let us know.


 At least for a couple of the clocks. A couple others still want to display text, instead of a clock.

 I have one question,
